LORETA
Coherence and Phase Differences
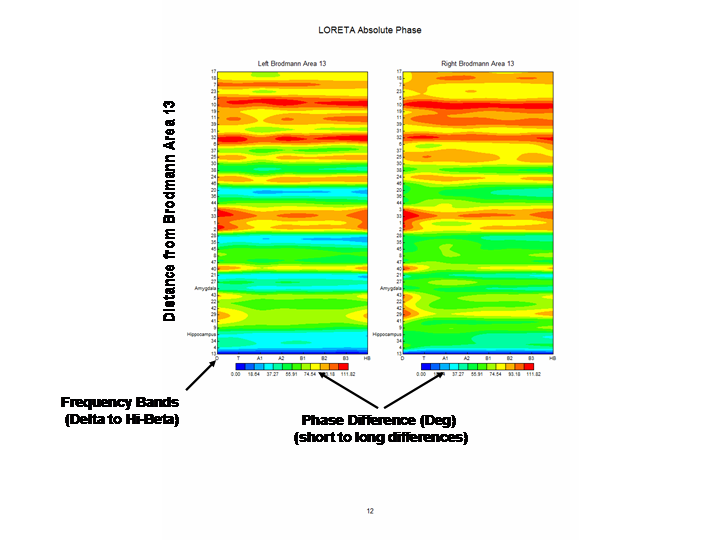
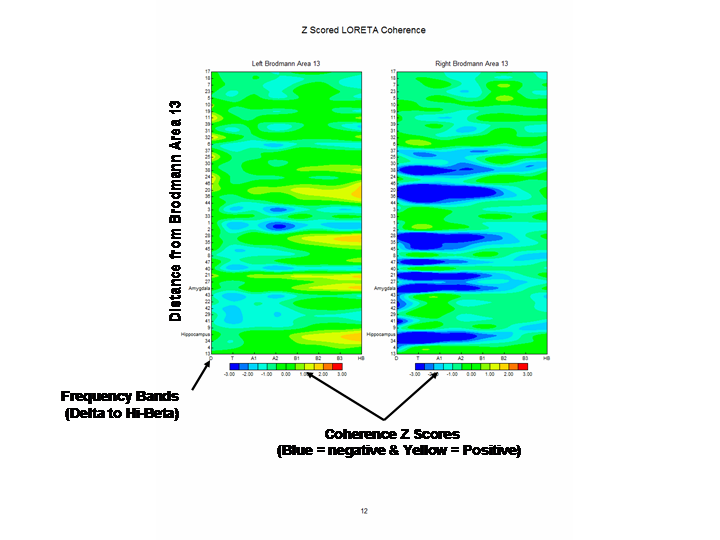
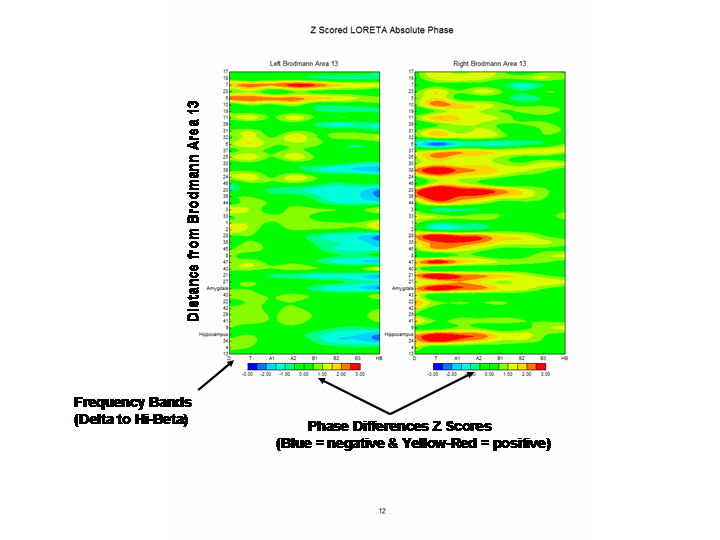
LORETA
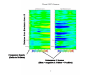
coherence and phase differences were computed by using cross-spectral analysis
of Hilbert transforms of the current sources from the center voxels of each of
44 Brodmann areas in the left and right hemisphere in eight different frequency
bands. The frequency bands were: delta 1-4 Hz; theta 4-7 Hz; alpha-1
8-10 Hz; alpha-2 10-12 Hz; beta-1 12-15 Hz; beta-2 15-18 Hz; beta-3 18-25 Hz;
gamma or hi-beta 25-30 Hz. Increases and decreases in coherence
and
phase
demonstrated
a distinct pattern that is spatially ordered based on the Euclidean distance
from
a
given
Brodmann
area. Volume conduction
can not explain horizontal alternating
blue
and
yellow-to-red
lines except the hypothesized action of 'U' shaped cortico-cortical fibers
because the distance between the horizontal bands are approximately those of the
cortico-cortical 'U' shaped fiber distances.


The
LORETA Coherence and Phase normative database Z Scores are an add on product.
Click
here to download documentation on LORETA Coherence and Phase Differences from
the Neuroguide Demo from a right hemisphere TBI patient.
This is a hyperlink to the mathematical and computational
details.
Contact us for more info
|